The following post was written by Maggy Stewart, Graphic Designer & Marketing Coordinator at RMS.
View the infographic here.
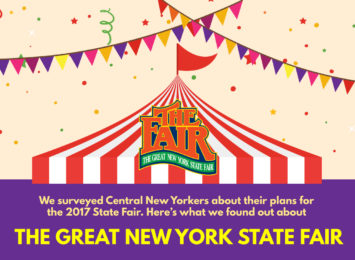
 Picking up ‘Great’ vibrations: majority of Central New Yorkers enjoyed the new layout and are most excited for The Beach Boys—and (gasp) there’s a new favorite food, RMS NY State Fair survey shows.
According to a recent poll of Central New Yorkers conducted by Research & Marketing Strategies, Inc. (RMS), 91 percent of survey respondents plan to go to the State Fair this year, which is not surprising considering the majority of respondents (59 percent) said the new layout of the fairgrounds led to a “better” experience. With over half of the respondents noticing some of the new changes made last year, their favorites were more seating (16 percent), main gate updates (14 percent), new layout (13 percent), and bigger midway (12 percent). When asked which musical acts respondents were most excited to see this year, The Beach Boys came in first at 35 percent.
A surprising ‘twist’ for the 2017 annual survey: Pizze fritte is no longer the favorite fair food. Coming in as respondents’ number one fair food for 2017 at 45 percent is milk, followed by BBQ (ribs, brisket, pulled pork, etc.) at 41 percent, and pizze fritte (39 percent). Tied at 37 percent were Gianelli sausage, ice cream, potatoes from the potato booth, and the blooming onion. Thirty-six percent of respondents can’t wait for the funnel cakes, followed by the gyro (32 percent), deep fried treats (28 percent), fries (27 percent) and roasted ears of corn (24 percent).
“Syracuse remains a top test market in the country, and thousands of vendors and new products are exhibited at this highly anticipated annual event that draws hundreds of thousands of people,” said Sandy Baker, RMS Senior Director of Corporate Strategy. Respondents surveyed were asked about favorite Fair attractions, foods, Midway games, spending habits, recent capital improvements, concert options and more.
Seventy-seven percent of respondents attended the New York State Fair last year, and most (62 percent) purchase their tickets in advance. The majority of respondents (52 percent) travel less than 20 miles to get to the fair, with 77 percent planning to drive themselves. Eight percent plan to arrive via bus, seven percent will take the Park-N-Ride Shuttle, four percent will get dropped off by their friends or family, and four percent plan to take an Uber or Lyft or are unsure. Although 36 percent have yet to decide what days they plan to attend, the most popular dates they plan to go are Saturday, August 26th and Saturday, September 2nd.
When asked how many times respondents planned on going to the fair, 31 percent plan on going three or more times. Almost 40 percent plan on attending just once. Up from 6.8 hours in 2016, respondents plan to spend an average of 7.36 hours at the state fair. Last year respondents typically spent $121.36 and planned to attend with one other person. This year they anticipate spending $127.97 at the fair and the majority plan to visit with two or four other people. Aside from food and drink, respondents said they typically buy clothes (31 percent), household items (27 percent), lottery tickets (27 percent), jewelry (26 percent), sunglasses (16 percent), outdoor items (15 percent), and caricatures (9 percent).
When asked to pick all of their favorite Fair attractions, 70 percent of respondents again identified the Chevy Court as their favorite, followed by the butter sculpture (69 percent), sand sculpture (67 percent), Center of Progress Building (57 percent), Taste NY (56 percent), Horticulture Building (49 percent), beer/wine tent (43 percent), art and craft exhibitions (42 percent), Midway rides and games (41 percent), International Building (38 percent), Science and Industry Building (33 percent), and Iroquois Indian Village (32 percent).
When asked which concerts respondents were most excited to see at the fair, following The Beach Boys came Earth, Wind & Fire (29 percent), 3 Doors Down (29 percent), The Marshall Tucker Band (20 percent), LeAnn Rimes (20 percent), Kansas (19 percent), Bret Michaels (18 percent), Kool & The Gang (17 percent), Brantley Gilbert (16 percent), Blue Öyster Cult (14 percent), and Spin Doctors (13 percent).
When it came to the Midway attractions, the water squirt race was again voted the favorite game by survey respondents with 34 percent. I Got It (tic tac toe board) came in second at 26 percent, followed by skee ball (23 percent), darts (21 percent), Whack-A-Mole (18 percent), lucky duck pond (15 percent), bowler roller (13 percent), rings (12 percent), fool the guesser (12 percent), basketball (eight percent) and beer bust (eight percent).
When asked to describe the New York State Fair in one word, respondents’ top answers were “fun,” “awesome,” “exciting,” “great,” “crowded,” and “tradition.”
If you would like to participate in upcoming RMS ViewPoint polls and surveys, please visit RMSViewPoint.com to sign up.
The RMS ViewPoint poll was conducted from August 10, 2017 to August 21, 2017. A total of 1445 surveys were completed. Respondents consisted of RMS ViewPoint Research Panel members, as well as the general community. For more information on RMS ViewPoint, visit RMSViewPoint.com.

Sad that the free cow ride was taken away that use to be in the Dairy Bldg. The under 5 year Olds loved it