Gearing Up for Going Back to School
In a recent survey to parents, conducted by our team at Research & Marketing Strategies, Inc. (RMS), it was discovered that going back to school has its share of perceived ups and downs. With everything that goes into getting prepared for the new school year, we were eager to find out where parents across the country stand on what it takes to become school-ready—for themselves and their children.
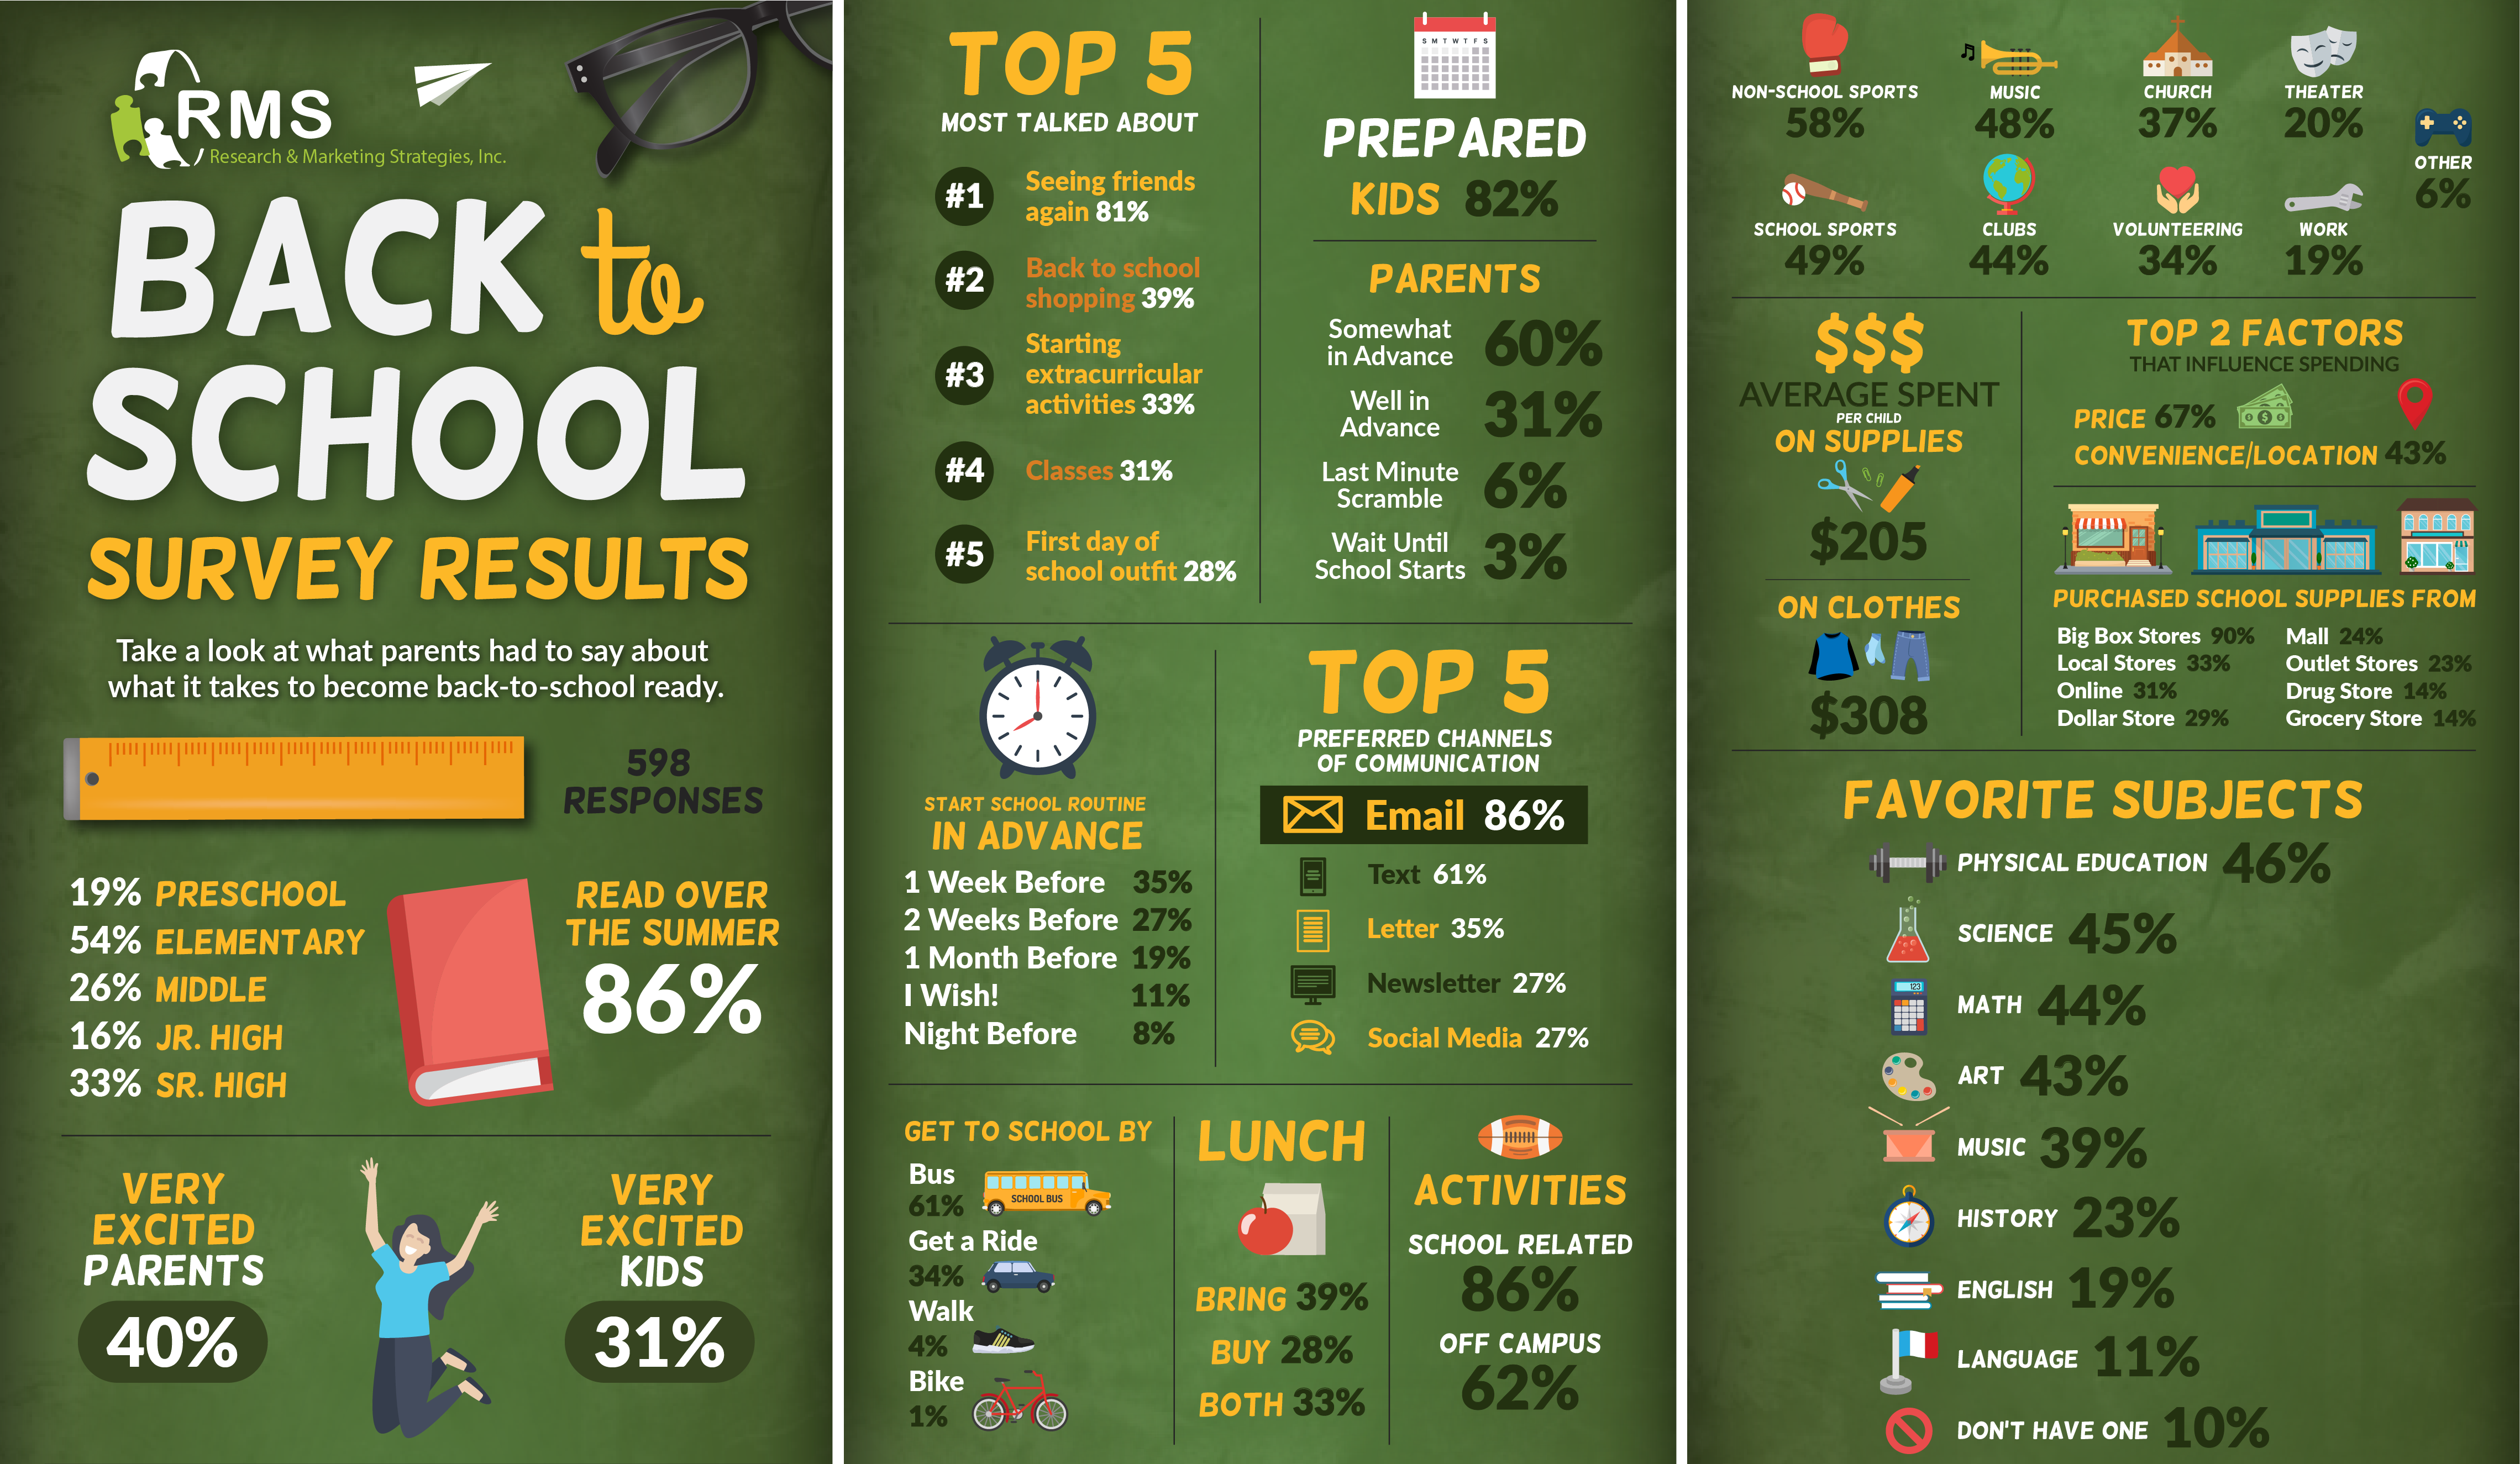
Out of 598 responses, with 73 percent representative of New York State, we learned reading ranked high with students over the summer months (86%). But as our sunny season comes to a close, most parents and children said they are generally excited for the start of the new school year, (parents 51%; children 53%). The range of school grade levels vary from Preschool (19%), Elementary (54%), Middle (26%), Jr. High (16%), to Sr. High (33%). We also learned the most talked about topic before going back to school is the “kids seeing their friends again,” at 81%. The other most talked about topics of conversation include, in consecutive order, “going back to school shopping,” “starting extracurricular activities,” “classes,” and the “first day of school outfit.”
When it comes to getting the kids ready for that first day, 82% of respondents said their children are prepared. We did uncover there are several differences between parents’ preparation level, starting with being prepared “somewhat in advance” (60%), followed by “well in advance” (31%), “last minute scramble” (6%), and lastly “not starting their preparations until school starts” (3%).
We also learned how far in advance these parents start the routines/habits with their children to get them ready for back to school; the majority starting one week before school starts (35%), followed by those starting routines two weeks in advance (27%), one month before (19%), “I wish!” (11%), and then just the night before (8%).
Not only is time a huge factor in getting everyone ready for going back to school, but money plays a big role as well. According to the RMS study, the average amount spent per child on school supplies is $205, and the average amount spent on clothes per child when going back to school shopping is $308. The top two factors that influence back to school spending is price (67%) and convenience/location (43%). With those factors in play, parents find themselves most often purchasing school supplies from big box stores like Target, Walmart, Kmart, etc. (90%). The other most popular places parents purchase school supplies are from local stores (33%), online (31%), and even less from dollar stores, the mall, outlet stores, drug stores, and grocery stores.
Once the school year is back in session, we asked respondents what their preferred channels of communication are from their kids’ school. The top five preferred channels of communication include: email (86%), texting (61%), letters sent home (35%), and newsletters tied with social media at 27%.
We asked our respondents how their children get to school every day, and we found out most of them ride the bus (61%), while a majority of the remainder get a ride (34%). Only 4% walk to school, and even less ride a bike to school (1%). Another big factor in the back to school bustle is lunchtime—with responses divided between kids who bring their lunch (39%), buy lunch at school (28%), and equally bring and buy lunch throughout the year (33%).
When it comes to the activities kids participate in, the majority are involved in school-related activities (86%), while 62% engage in off-campus activities. The breakdown of all these activities include: non-school affiliated sports (58%), school sports (49%), music (48%), clubs (44%), church (37%), volunteering (34%), theater (20%), work (19%), and other—including ROTC, video games, outdoor activities, library programs, therapy, etc. (6%).
Finally, parents shared what their children’s favorite subjects were in school, and Physical Education was at the top of the list (46%), followed by Science (45%), Math (44%), Art (43%), Music (39%), History (23%), English (19%), and Foreign Language (11%). The study found 10% of kids did not have a favorite subject at all.
When asked to describe going back to school in one word, respondents’ top answers were: exciting, expensive, stressful, hectic, happy, relief, busy, chaotic, fun, sad, and challenging. To view the full word cloud, click here.
To download a PDF of the detailed infographic depicting the full survey results, please click here. If you would like to participate in upcoming RMS ViewPoint polls and surveys, please visit RMSViewPoint.com to sign up.
The RMS ViewPoint Back to School survey was conducted from July 26, 2019 through August 12, 2019. A total of 598 surveys were completed. Respondents consisted of RMS ViewPoint Research Panel members, as well as the general community throughout the United States, with 434 responses from New York State. For more information on RMS ViewPoint, visit RMSViewPoint.com.
Research & Marketing Strategies (RMS) is a full-service market research and consulting firm located in Baldwinsville, NY. RMS provides an array of research methodologies that result in actionable analytics and recommendations for clients to enhance decision making. RMS is also home to QualiSight, a premier focus group, recruiting and interview research facility, and ViewPoint, a leading consumer research panel in Central New York, one of the nation’s top test markets. Visit our website at RMSresults.com. If you are interested in learning more about our research capabilities, please contact Sandy Baker, our Vice President of Corporate Development at [email protected] or by calling 315.635.9802.