The Effective Use of R in Market Research

Article by Katya Dashkevich, RMS Research Associate –
The use of R, an open-source statistical tool, can help us identify new trends and predict patterns using machine learning. Machine learning in R allows us to teach it to recognize patterns within data without providing specific parameters.
To effectively use R and machine learning, we first need to clean our data using the various functions that R provides. Afterward, we must determine the appropriate algorithm to use and decide whether it should be supervised or unsupervised. Supervised learning involves training the model with labeled data (data that includes both inputs and known outputs), while unsupervised learning explores patterns and relationships in data without predefined labels or outcomes.
Once the type of learning is selected, R needs to be instructed on what characteristics to look for in the data to train the algorithm. This training enables the algorithm to identify patterns within the initial dataset and recognize additional patterns in other datasets that will be uploaded. The algorithm becomes better at identifying trends and patterns with continual exposure to new datasets.
With this information, insights can be gathered for clients by applying previous data collection and algorithmic training to new and future datasets. This helps clients gain more meaningful information to address their current needs effectively.
R is a valuable tool for many reasons and has various applications in market research. R can help analyze large datasets to uncover hidden patterns and trends over time. It can also be used to look at historical data and can be used to predict future satisfaction trends, helping clients plan and address customer needs in real time. Machine learning can segment customers into groups based on satisfaction levels or behaviors for more targeted strategies. Machine learning can flag unusual feedback or satisfaction drops, helping clients address potential problems quickly.

Some of the more common R algorithms that are used within machine learning are:
- Linear Discriminant Analysis (LDA): This algorithm will help separate things into predefined categories and will find the best way to divide the data.
- Classification and Regression Trees (CART): This algorithm is like a flowchart that will ask yes or no questions to figure out how to classify the data and in turn will use the answers given to create a prediction
- k-Nearest Neighbors (kNN): kNN will look at nearby examples to decide what category something should be in.
- Support Vector Machines (SVM) with a linear kernel: SVM will draw a straight line (or plane) between groups to separate them as clearly as possible, like dividing apples from oranges on a table.
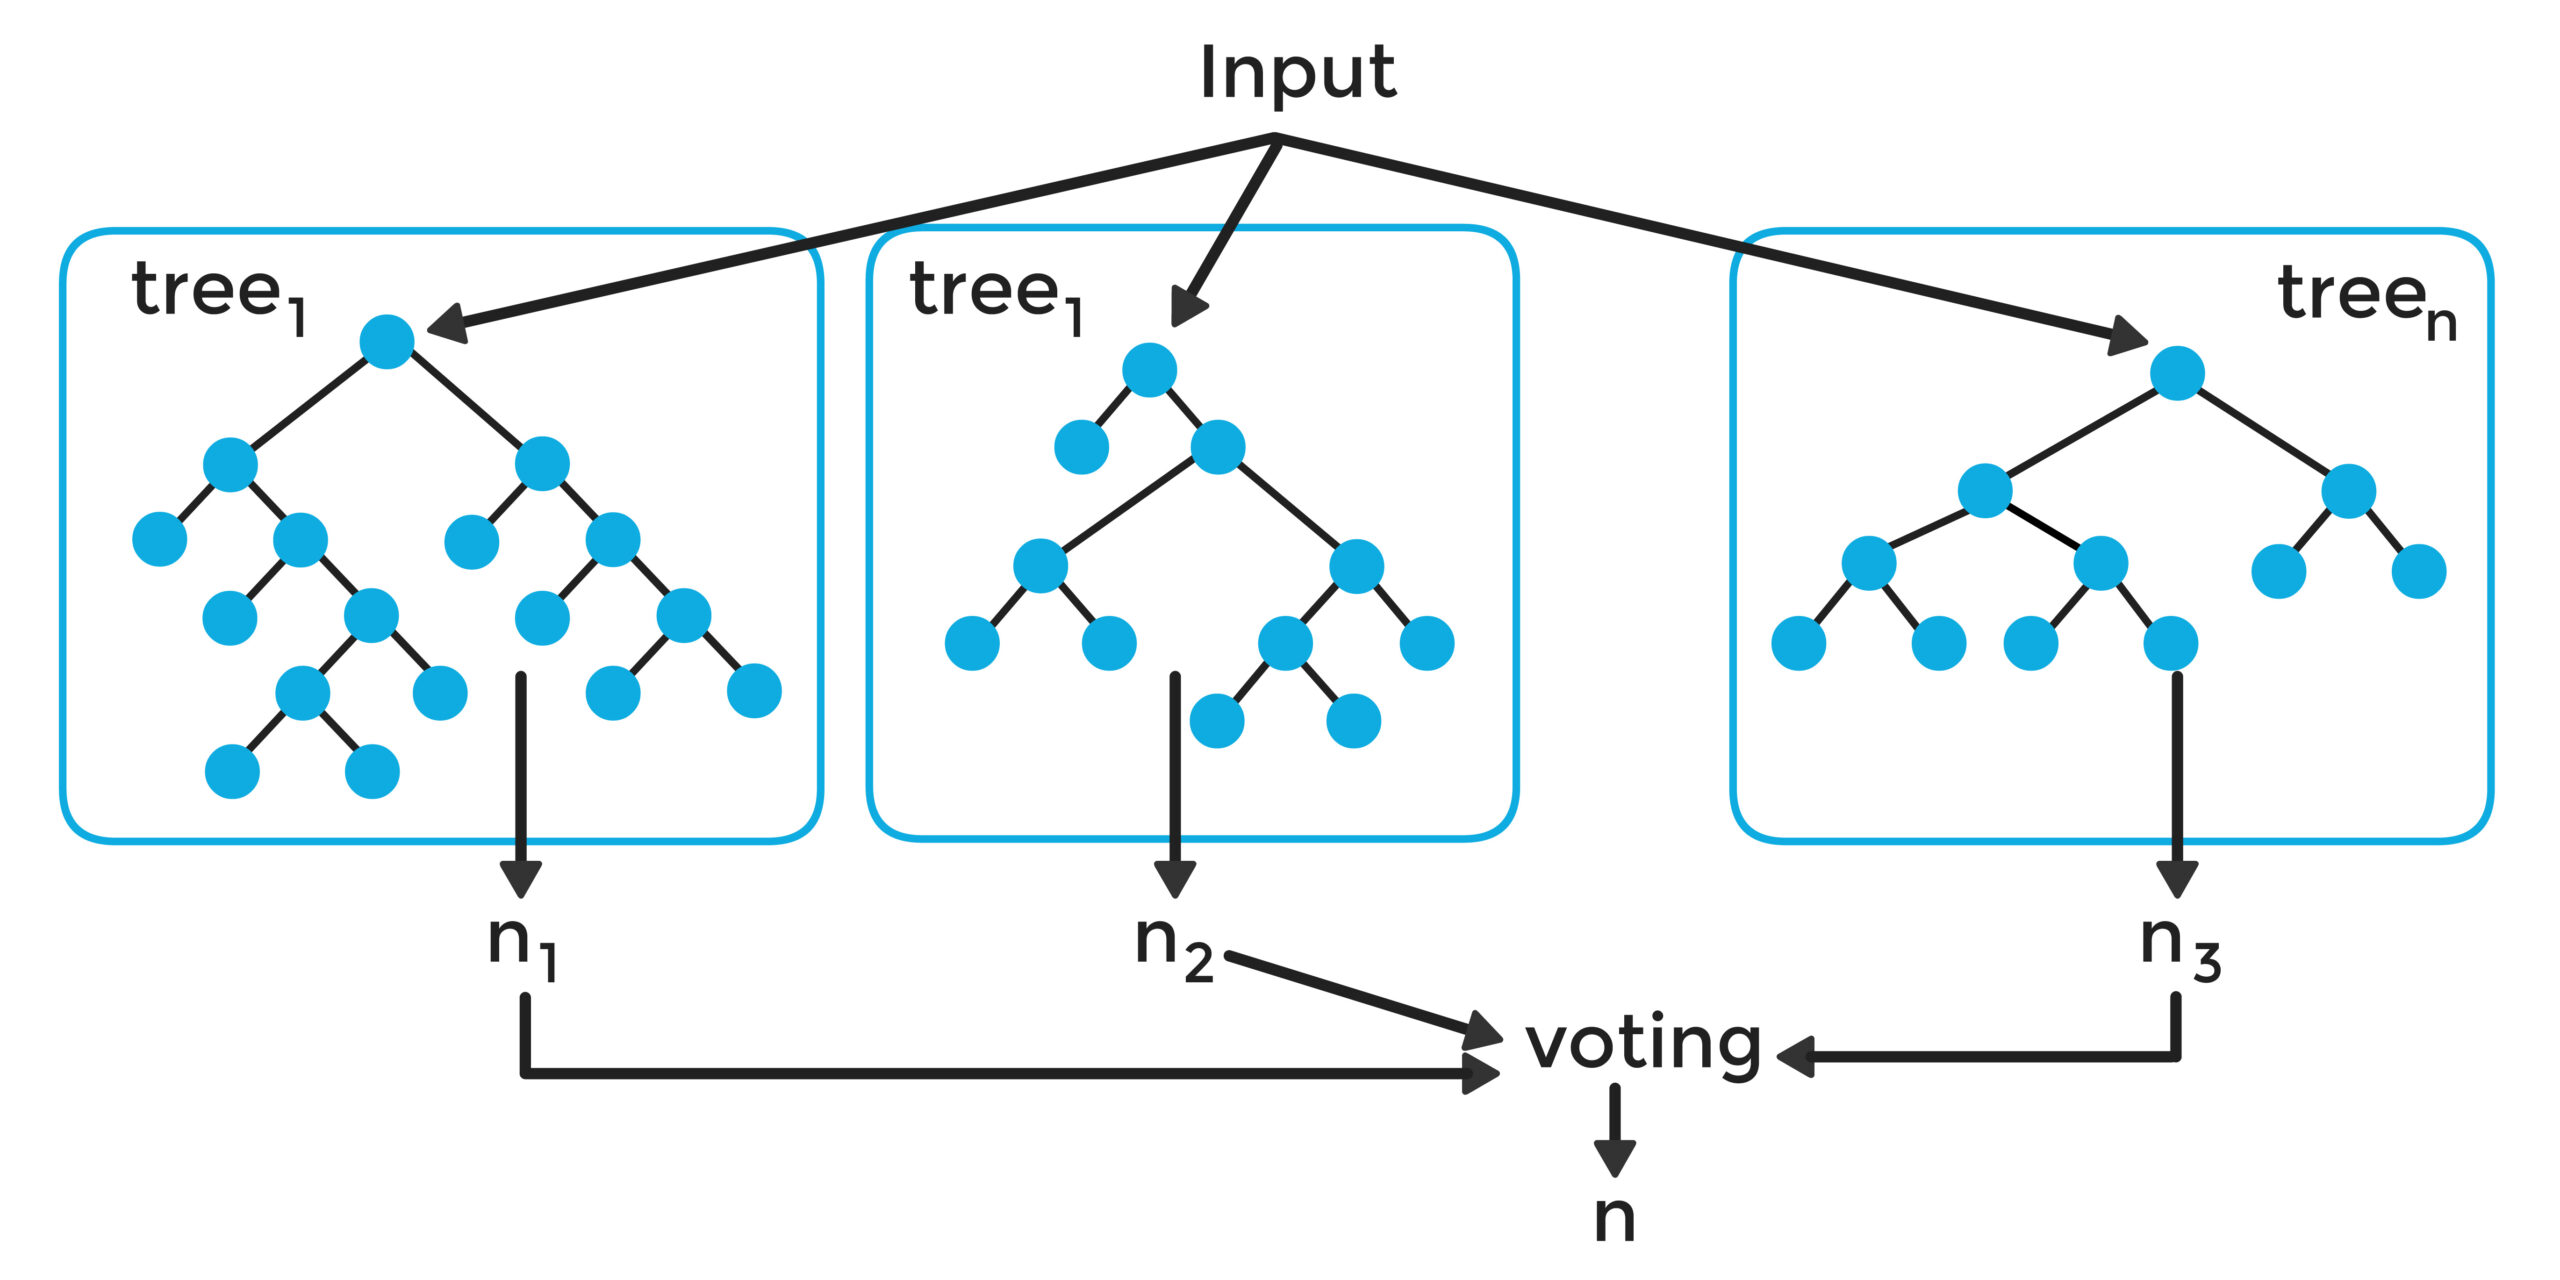
- Random Forest (RF): RF is like asking multiple decision trees (flow charts) the same question and going with the majority answer for a more accurate result.
One applicable algorithm when it comes to market research would be Random Forest due to its ability to handle large data sets that are seen in market research like customer data with many attributes.
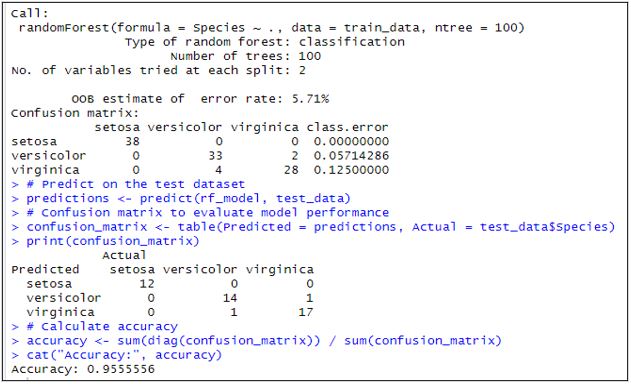
An example of random forest being used you can see below. The data set used a built in one found in R called “iris” which is a large dataset contain different flowers and their characteristics like petal length etc.
When looking at the output below:
- Number of trees: The total number of decision trees (flow charts) in the forest (100 in this case).
- Out-of-bag (OOB) error rate: A measure of how well the model performs on data it has not seen during training.
- Variable importance: Information about which features contribute the most to predictions (ex: petal length, sepal width, etc.).
- The confusion matrix compares the predicted species to the actual species in the test dataset.
- The accuracy score is calculated by dividing the number of correct predictions by the total number of predictions. Meaning this model was able to classify 95.6% of the flowers in the set.
 Whether it is R, SPSS, or any other statistical package being used to analyze data, the overarching goal for RMS is to make sure that the findings are meaningful and help your business make better decisions. In some cases, R might be the right solution, and another tool may be more appropriate at other times. The key is to have a firm understanding of a client’s goals and objectives to make sure that at the end of the study, the data helps drive an organization forward with authentic, accurate, and meaningful insights.
It’s good to know. We’re here for you.
About the Author – Katya Dashkevich
 Katya brings years of market research experience to the RMS Analytics Department, programming surveys, coordinating recruitment, and cleaning, analyzing, and reporting survey data. Katya also supports many other divisions at RMS, including helping with phone recruitment in our call center or research needs within our healthcare division.
It’s good to know. We’re here for you.
Call us today, to see how we can help your organization.
Interested in conducting a market research project with RMS?
Contact our Vice President of Corporate Development, Sandy Baker at SandyB@RMSresults.com or call 1-866-567-5422.
About RMS
Research & Marketing Strategies, Inc. (RMS) is a full-service market research firm in Central New York. Formed in 2002, RMS helps organizations that are looking to know more about their customers and/or potential customers. We conduct surveys, focus groups, mystery shopping, studies, and analyses. Each project is customized and gets personal attention so that actionable, data-driven findings are delivered. RMS has a reputation for getting results. We offer an independent, professional means to conduct telephone, on-line, and mail surveying, as well as in-depth interviews, intercept interviews, and participant recruitment. We also host discussion groups through QualiSight, our onsite call center and focus group facility. We have a proven reputation for successfully recruiting and moderating focus groups, community forums, and town meetings.